What Experts Are Saying About the 2023 Housing Market
 If you’re thinking about buying or selling a home soon, you probably want to know what you can expect from the housing market this year. In 2022, the market underwent a major shift as economic uncertainty and higher mortgage rates reduced buyer demand, slowed the pace of home sales, and moderated home prices. But what about 2023?
An article from HousingWire offers this perspective:
“The red-hot housing market of the past 2 ½ years was characterized by sub-three percent mortgage rates, fast-paced bidding wars and record-low inventory. But more recently, market conditions have done an about-face. . . . now is the opportunity for everyone to become re-educated about what a ‘typical’ housing market looks like.”
This year, experts agree we may see the return of greater stability and predictability in the housing market if inflation continues to ease and mortgage rates stabilize. Here’s what they have to say.The 2023 forecast from the National Association of Realtors (NAR) says:
“While 2022 may be remembered as a year of housing volatility, 2023 likely will become a year of long-lost normalcy returning to the market, . . . mortgage rates are expected to stabilize while home sales and prices moderate after recent highs, . . .”
Danielle Hale, Chief Economist at realtor.com, adds:
“. . . buyers will not face the extreme competition that was commonplace over the past few years.”
Lawrence Yun, Chief Economist at NAR, explains home prices will vary by local area, but will net neutral nationwide as the market continues to adjust:
“After a big boom over the past two years, there will essentially be no change nationally . . . Half of the country may experience small price gains, while the other half may see slight price declines.”
Mark Fleming, Chief Economist at First American, says:
“The housing market, once adjusted to the new normal of higher mortgage rates, will benefit from continued strong demographic-driven demand relative to an overall, long-run shortage of supply.”
Bottom Line
If you’re looking to buy or sell a home this year, the best way to ensure you’re up to date on the latest market insights is to partner with a trusted real estate advisor. Let’s connect.
What’s Ahead for Mortgage Rates and Home Prices?

Now that the end of 2022 is within sight, you may be wondering what’s going to happen in the housing market next year and what that may mean if you’re thinking about buying a home. Here’s a look at the latest expert insights on both mortgage rates and home prices so you can make your best move possible.
Mortgage Rates Will Continue To Respond to Inflation
There’s no doubt mortgage rates have skyrocketed this year as the market responded to high inflation. The increases we’ve seen were fast and dramatic, and the average 30-year fixed mortgage rate even surpassed 7% at the end of last month. In fact, it’s the first time they’ve risen this high in over 20 years (see graph below):
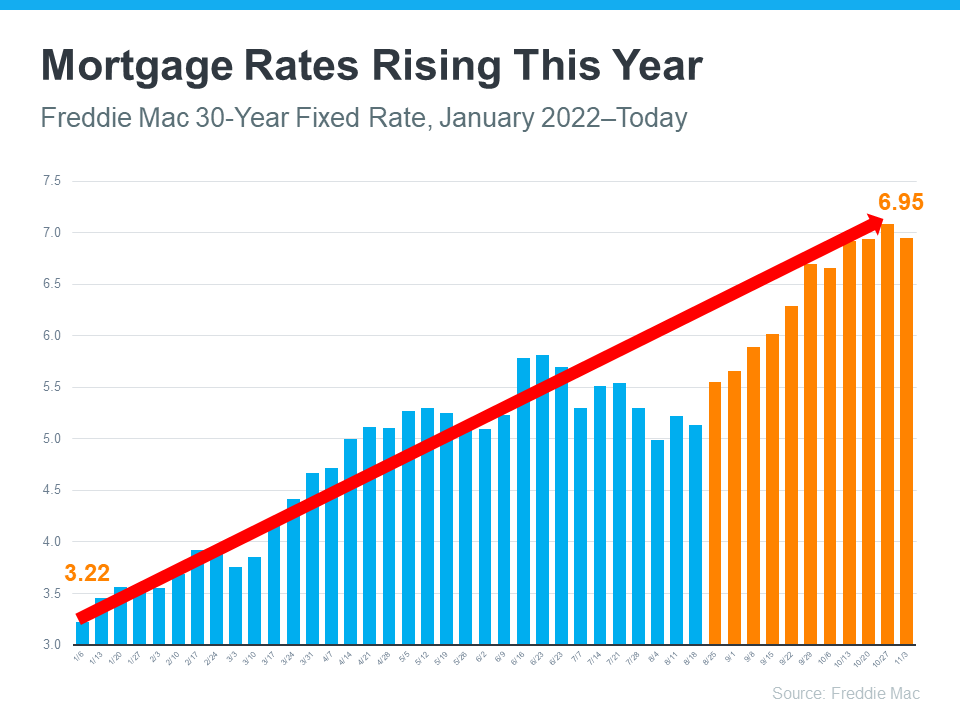
In their latest quarterly report, Freddie Mac explains just how fast the climb in rates has been:
“Just one year ago, rates were under 3%. This means that while mortgage rates are not as high as they were in the 80’s, they have more than doubled in the past year. Mortgage rates have never doubled in a year before.”
Because we’re in unprecedented territory, it’s hard to say with certainty where mortgage rates will go from here. Projecting the future of mortgage rates is far from an exact science, but experts do agree that, moving forward, mortgage rates will continue to respond to inflation. If inflation stays high, mortgage rates likely will too.
Home Price Changes Will Vary by Market
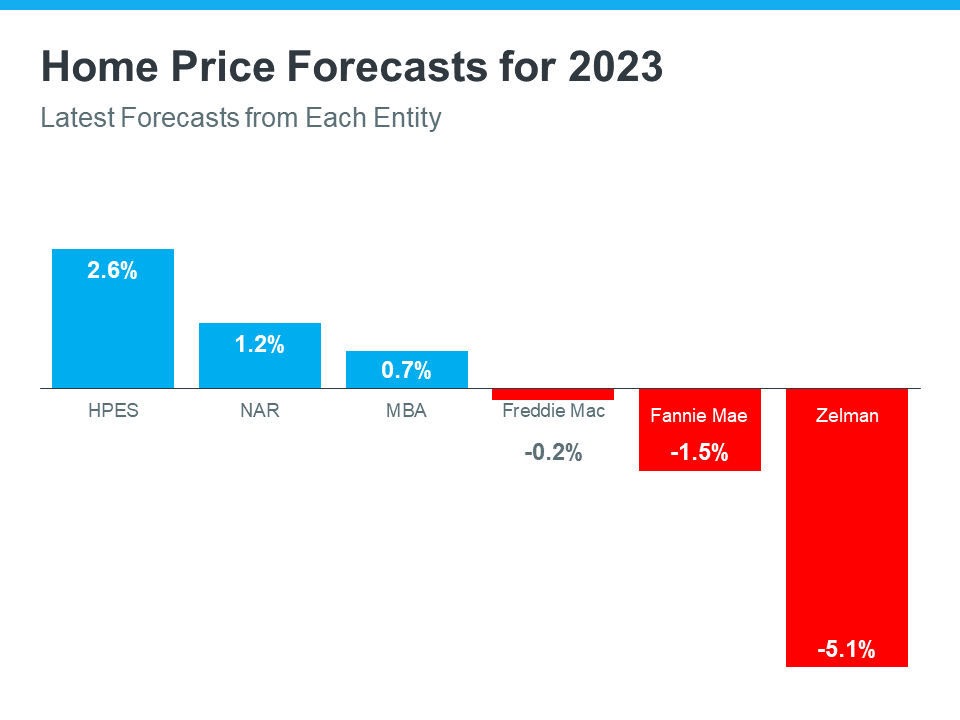
As buyer demand has eased this year in response to those higher mortgage rates, home prices have moderated in many markets too. In terms of the forecast for next year, expert projections are mixed. The general consensus is home price appreciation will vary by local market, with more significant changes happening in overheated areas. As Mark Fleming, Chief Economist at First American, says:
“House price appreciation has slowed in all 50 markets we track, but the deceleration is generally more dramatic in areas that experienced the strongest peak appreciation rates.”
Basically, some areas may still see slight price growth while others may see slight price declines. It all depends on other factors at play in that local market, like the balance between supply and demand. This may be why experts are divided on their latest national forecasts (see graph below):
Bottom Line
If you want to know what’s happening with home prices or mortgage rates, let’s connect so you have the latest on what experts are saying and what that means for our area.
3 Graphs Showing Why Today’s Housing Market Isn’t Like 2008

With all the headlines and talk in the media about the shift in the housing market, you might be thinking this is a housing bubble. It’s only natural for those thoughts to creep in that make you think it could be a repeat of what took place in 2008. But the good news is, there’s concrete data to show why this is nothing like the last time.
There’s Still a Shortage of Homes on the Market Today, Not a Surplus
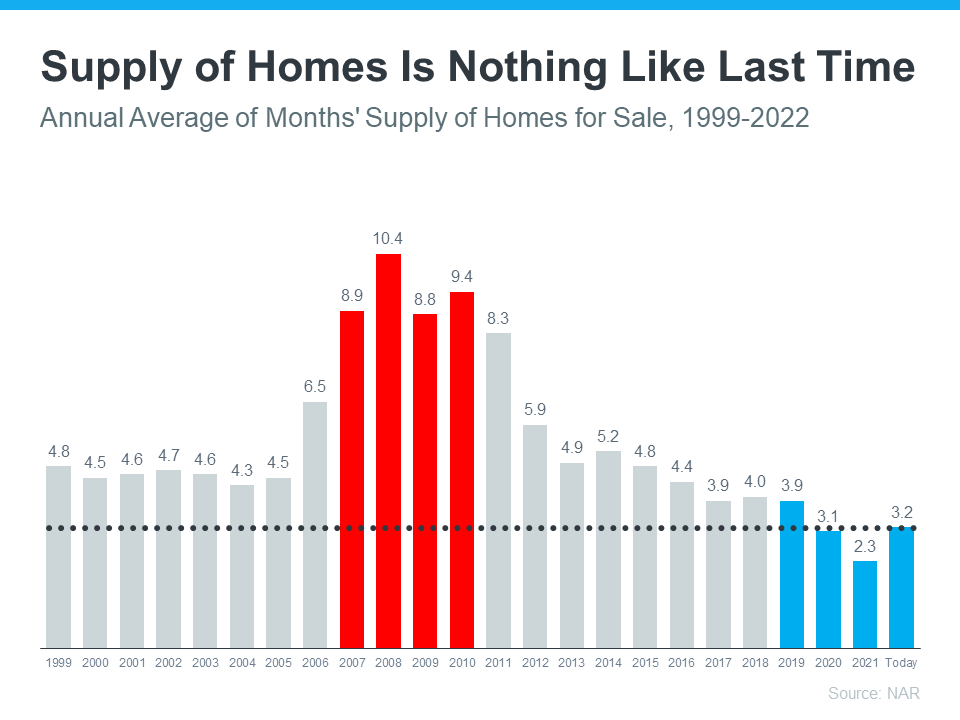
For historical context, there were too many homes for sale during the housing crisis (many of which were short sales and foreclosures), and that caused prices to fall dramatically. Supply has increased since the start of this year, but there’s still a shortage of inventory available overall, primarily due to almost 15 years of underbuilding homes.
The graph below uses data from the National Association of Realtors (NAR) to show how the months’ supply of homes available now compares to the crash. Today, unsold inventory sits at just a 3.2-months’ supply at the current sales pace, which is significantly lower than the last time. There just isn’t enough inventory on the market for home prices to come crashing down like they did last time, even though some overheated markets may experience slight declines.
Mortgage Standards Were Much More Relaxed Back Then
During the lead-up to the housing crisis, it was much easier to get a home loan than it is today. Running up to 2006, banks were creating artificial demand by lowering lending standards and making it easy for just about anyone to qualify for a home loan or refinance their current home.
Back then, lending institutions took on much greater risk in both the person and the mortgage products offered. That led to mass defaults, foreclosures, and falling prices. Today, things are different, and purchasers face much higher standards from mortgage companies.
The graph below uses Mortgage Credit Availability Index (MCAI) data from the Mortgage Bankers Association (MBA) to help tell this story. In that index, the higher the number, the easier it is to get a mortgage. The lower the number, the harder it is. In the latest report, the index fell by 5.4%, indicating standards are tightening.
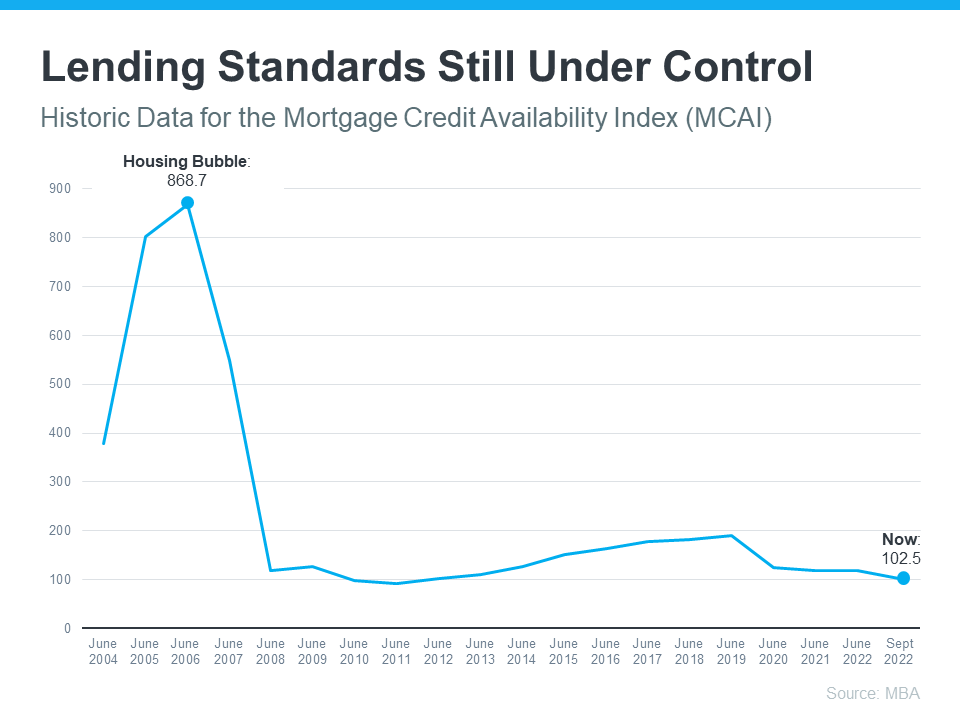
This graph also shows just how different things are today compared to the spike in credit availability leading up to the crash. Tighter lending standards over the past 14 years have helped prevent a scenario that would lead to a wave of foreclosures like the last time.
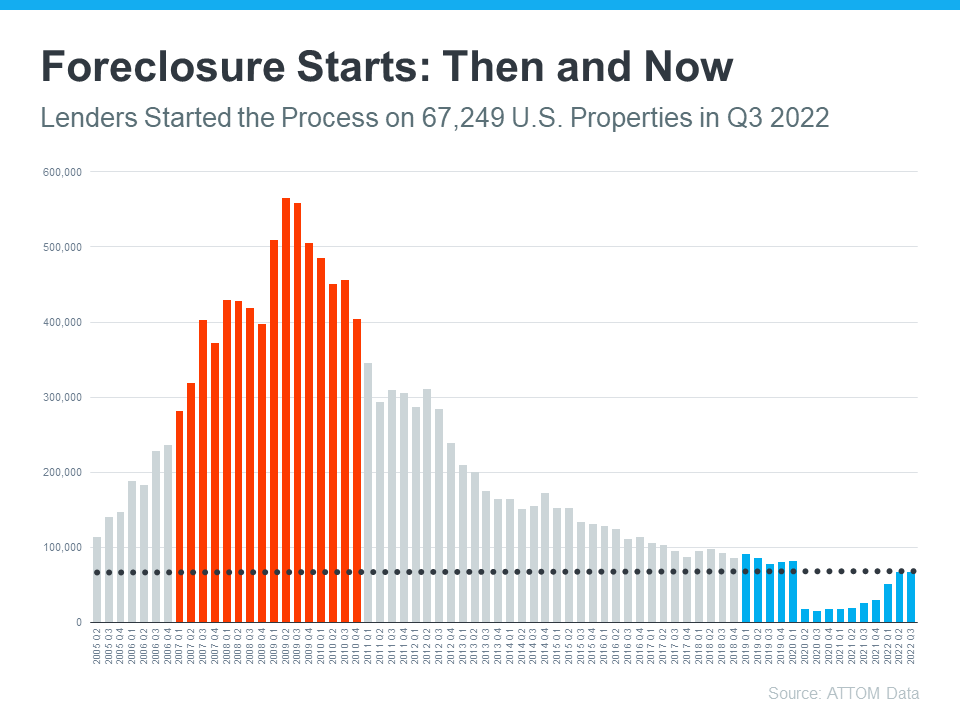
The Foreclosure Volume Is Nothing Like It Was During the Crash
Another difference is the number of homeowners that were facing foreclosure after the housing bubble burst. Foreclosure activity has been lower since the crash, largely because buyers today are more qualified and less likely to default on their loans. The graph below uses data from ATTOM Data Solutions to help paint the picture of how different things are this time:
Not to mention, homeowners today have options they just didn’t have in the housing crisis when so many people owed more on their mortgages than their homes were worth. Today, many homeowners are equity rich. That equity comes, in large part, from the way home prices have appreciated over time. According to CoreLogic:
“The total average equity per borrower has now reached almost $300,000, the highest in the data series.”
Rick Sharga, Executive VP of Market Intelligence at ATTOM Data, explains the impact this has:
“Very few of the properties entering the foreclosure process have reverted to the lender at the end of the foreclosure. . . . We believe that this may be an indication that borrowers are leveraging their equity and selling their homes rather than risking the loss of their equity in a foreclosure auction.”
This goes to show homeowners are in a completely different position this time. For those facing challenges today, many have the option to use their equity to sell their house and avoid the foreclosure process.
Bottom Line
If you’re concerned we’re making the same mistakes that led to the housing crash, the graphs above should help alleviate your fears. Concrete data and expert insights clearly show why this is nothing like the last time.
Perspective Matters When Selling Your House Today

Does the latest news about the housing market have you questioning your plans to sell your house? If so, perspective is key. Here are some of the ways a trusted real estate professional can explain the shift that’s happening today and why it’s still a sellers’ market even during the cooldown.
Fewer Homes for Sale than Pre-Pandemic
While the supply of homes available for sale has increased this year compared to last, we’re still nowhere near what’s considered a balanced market. A recent article from Calculated Risk helps put this year’s increased inventory into context (see graph below):
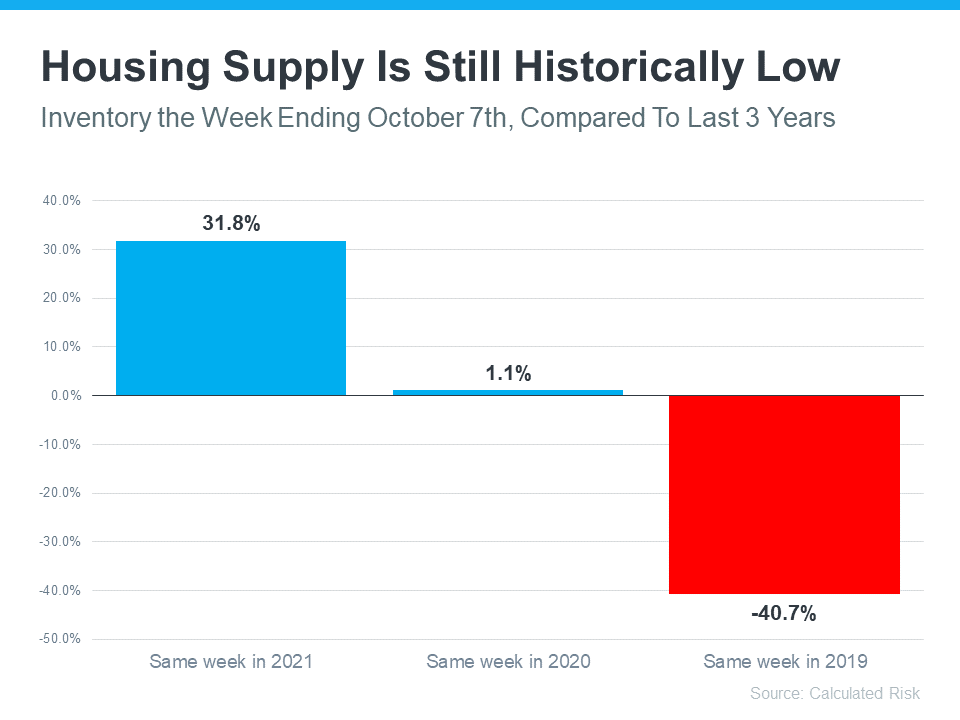
It shows supply this year has surpassed 2021 levels by over 30%. But the further back you look, the more you’ll understand the big picture. Compared to 2020, we’re just barely above the level of inventory we saw then. And if you go all the way back to 2019, the last normal year in real estate, we’re roughly 40% below the housing supply we had at that time.
Why does this matter to you? When inventory is low, there is still demand for your house because there just aren’t enough homes available for sale.
Homes Are Still Selling Faster Than More Normal Years
And while homes aren’t selling as quickly as they did a few months ago, the average number of days on the market is still well below pre-pandemic norms – in large part because inventory is so low. The graph below uses data from the Realtors’ Confidence Index by the National Association of Realtors (NAR) to illustrate this trend:
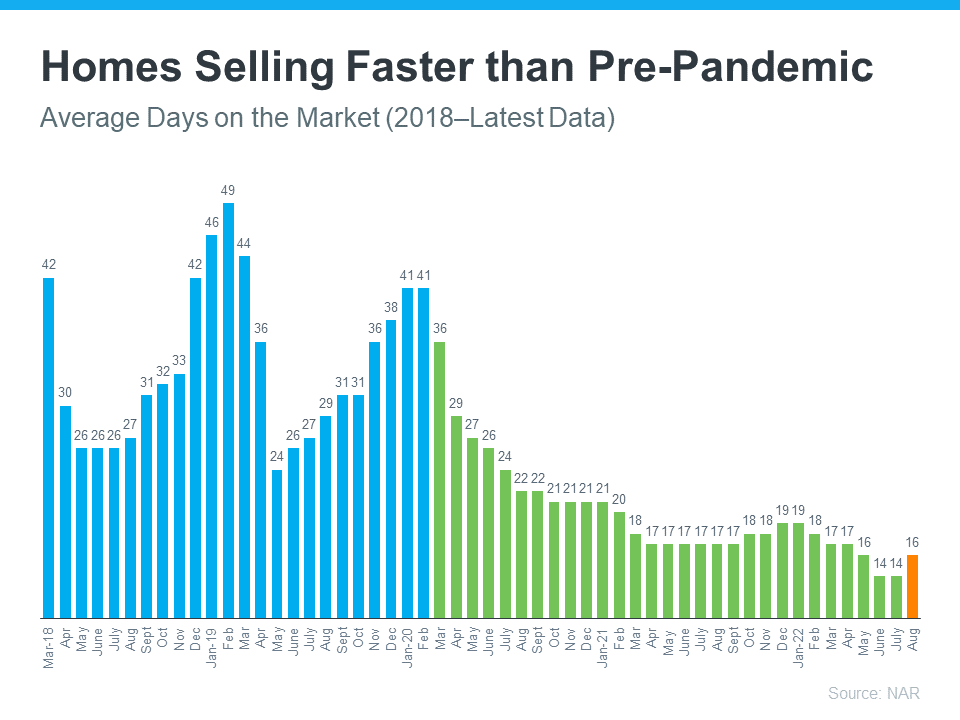
As the graph shows, the pre-pandemic numbers (shown in blue) are higher than the numbers we saw during the pandemic (shown in green). That’s because the average days on the market started to decrease as homes sold at record pace during the pandemic. Most recently, due to the cooldown in the housing market, the average days on the market have started to tick back up slightly (shown in orange) but are still far below the pre-pandemic norm.
What does this mean for you? While it may not be as fast as it was a couple of months ago, homes are still selling much faster than they did in more normal, pre-pandemic years. And if you price it right, your home could still go under contract quickly.
Buyer Demand Has Moderated and Is Now in Line with More Typical Years
Buyer demand has softened this year in response to rising mortgage rates. But again, perspective is key. Getting 3-5 offers like sellers did during the pandemic isn’t the norm. The graph below uses data from NAR going back to 2018 to help tell the story of this shift over time (see graph below):
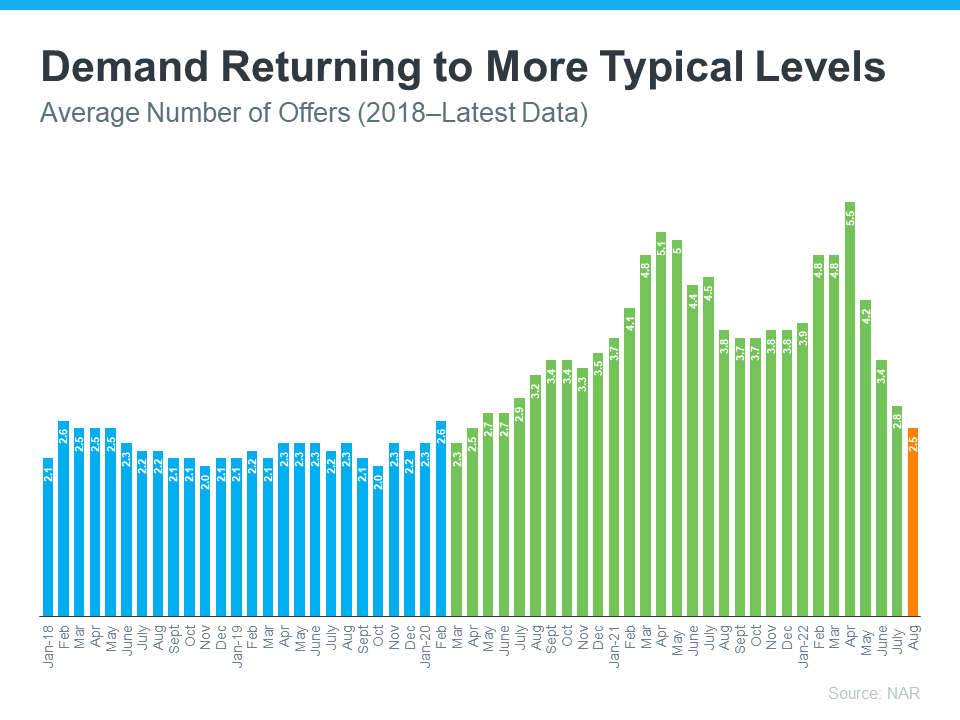
Prior to the pandemic, it was typical for homes sold to see roughly 2-2.5 offers (shown in blue). As the market heated up during the pandemic, the average number of offers skyrocketed as record-low mortgage rates drove up demand (shown in green). But most recently, the number of offers on homes sold today (shown in orange) has started to return to pre-pandemic levels as the market cools from the frenzy.
What’s the takeaway for you? Buyer demand has moderated from the pandemic peak, but it hasn’t disappeared. The buyers are still out there, and if you price your house at current market value, you’ll still be able sell your house today.
Bottom Line
If you have questions about selling your house in today’s housing market, let’s connect. That way you have context around what’s happening now, so you’re up to date on what you can expect when you’re ready to move.
Homeowners Still Have Positive Equity Gains over the Past 12 Months

If you’re a homeowner, your net worth got a big boost over the past few years thanks to rapidly rising home prices. Here’s how it happened and what it means for you, even as the market moderates.
Equity is the current value of your home minus what you owe on the loan.
Because there was a significant imbalance between the number of homes available for sale and the number of buyers looking to make a purchase over the past few years, home prices appreciated substantially.
And while home price appreciation has moderated this year, and even depreciated slightly in some overheated markets, that doesn’t mean you’ve lost all the equity you gained during the pandemic frenzy.
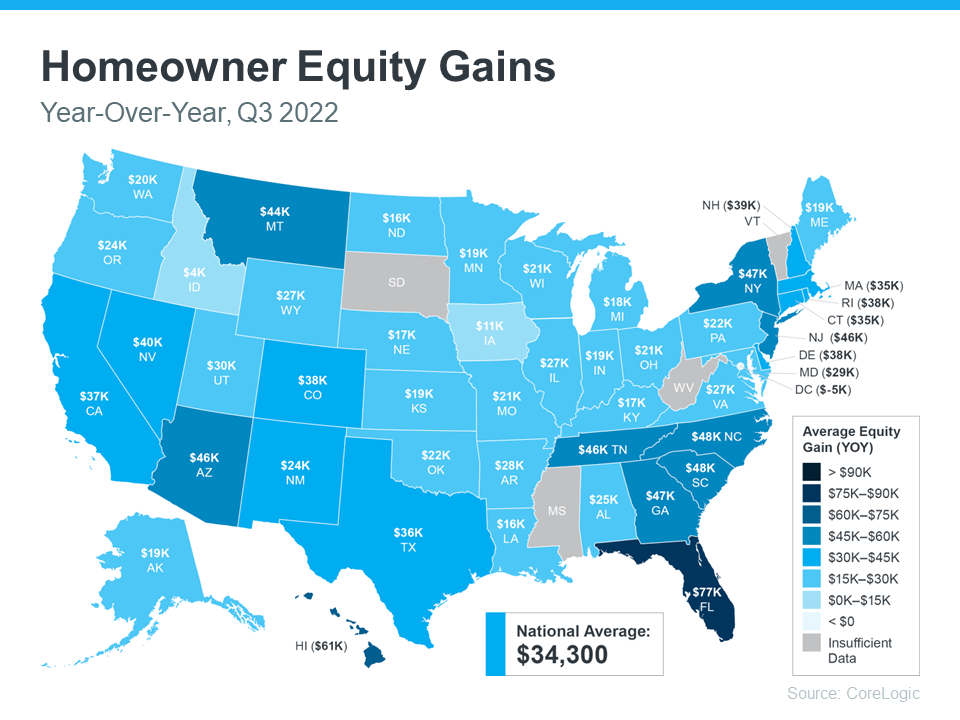
To prove you still have equity you can use, the latest Homeowner Equity Insights from CoreLogic finds the average homeowner equity has actually grown by $34,300 over the past 12 months.
That’s right, despite the headlines, the average homeowner still gained positive equity over the last year in just about every market. While the gains aren’t as dramatic as they were in the previous quarter due to home price moderation, they’re still significant. And if you’ve been in your home for longer than a year, chances are you have even more equity than you realize.
While that’s the national number, if you want to know what happened over the past year in your area, look at the map below from CoreLogic:
Why This Is So Important Right Now
While equity helps increase your overall net worth, it can also help you achieve other goals, like buying your next home. When you sell your current house, the equity you’ve built up comes back to you in the sale, and it may be just what you need to cover a large portion – if not all – of the down payment on your next home.
So, if you’ve been holding off on selling because you weren’t sure what the headlines meant for your bottom line, rest assured you’ve still gained equity in recent years, and it can help fuel your move.
Bottom Line
If you’re planning to make a move, the equity you’ve gained over time can make a big impact. To find out just how much equity you have in your current home and how you can use it to fuel your next purchase, let’s connect.
Recent Posts
![Achieve Your Dream of Homeownership with Condos and Townhomes [INFOGRAPHIC]](https://img.chime.me/image/fs/chimeblog/20240217/16/original_dfa7c035-5dfc-431f-9632-0a1387532bd1.png)


![Winning Plays for Buying a Home in Today’s Market [INFOGRAPHIC]](https://img.chime.me/image/fs/chimeblog/20240210/16/original_949ffbaa-7b98-4ded-bdcb-710d8e954a85.png)